👋 I’m so glad YOU are here. Are you looking to also get your partner prepared? This is for BOTH of you. Couples just love it and I know you want to both feel prepared!
These are some fascinating facts about pregnancy & birth that every pregnant family should know. Everything from fears, to tearing, to assisted deliveries, we’ve got some serious cited facts for you!
Hi, I’m Hilary — The Pregnancy Nurse 👩⚕️. I have been a nurse since 1997 and I have 20 years of OB nursing experience, I am also the curly head behind Pulling Curls and The Online Prenatal Class for Couples. 🩺 I have helped thousands of families have their baby and I was FACINATED by these numbers.
If you want, click to the area you’re interested in:
What Do You Want to Know About?
Birth Fears Statistics
68% of pregnant people fear having a cesarean section
61% of pregnant people fear having a BM at delivery
48% of pregnant people are worried about communicating with their healthcare team
81% of pregnant people fear something going wrong with the baby
72% of pregnant people are worried about something going wrong with them.
18% of pregnant people are worried their partner won’t be very supportive
77% of pregnant people are worried about tearing at delivery
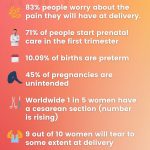
83% of pregnant people are worried about the pain they will feel at delivery
70% of pregnant people are worried about labor taking a long time
56% of pregnant people are worried about getting the epidural
83% of pregnant people are worried about life postpartum
All information in this section from my original research on birth fears
BTW, a prenatal class helps a LOT of these fears!
I also did a podcast on labor fears:
Prenatal Care Statistics
71% of women start prenatal care in the first trimester
Less than 5% of all women began prenatal care in their third trimester
1.6% of pregnant women receive no prenatal care at all.
Women in their 30’s are the most likely to start care in their first trimester (82%)
Mothers under 20 were least likely to receive first trimester prenatal care (61%)
Mothers under 15 were only 36% as likely get prenatal care.
Information in this section is from a report from the national vital statistics
Births in the US
In 2020 there were 3,613,647 births in the United States
That is a birth rate of 11/1,000 in the population
56 births per 1,000 women aged 15-44 in 2020
8.24% of babies had a low birth weight
10.09% were born preterm
40.5% of pregnant families were not married
and the mean age of women at their first birth was 27.1
50.2% of births are covered by private insurance
42% are covered by medicaid
3.9% of births were self pay (the other births were covered under “other” insurance including Indian tribal care or Tricare, or a charity).
The 2020 twin birth rate was 31.1 twins per 1,000 live births (a 3% decline from 2019)
Triplets or more was 79.6 per 100,000 births (a 9% decline from 2019).
Final birth data for 2020 from the National Vital Statistics Report https://www.cdc.gov/nchs/data/nvsr/nvsr70/nvsr70-17.pdf
Unwanted/Unplanned Pregnancy Statistics
Please note that I looked for studies more recent since 2011, but this was by far the most comprehensive data set.
In 2011 there were 98 pregnancies for every 1,000 woman aged 15-44 in the US
In 2011 there were 45 unintended pregnancies for every 1,000 women, meaning nearly 5% of women have an unintended pregnancy each year.
In 2011 45% of the 6.1 million pregnancies in the US were unintended.
Of those, 27% were “wanted later”, and 18% were “unwanted”
The rate of unintended pregnancy among women with incomes less than 100% of the poverty level was 112 per 1,000 — which is more than five times the rate among women with incomes of at least 200% of the poverty level
The highest unintended pregnancy rate in 2011 was among women of 20-24 (81 out of 1,000 women). Please note that when women ages 15-19 are pared down to only those who are sexually active, they have a higher rate.
Cohabiting women had a higher rate of unwanted pregnancy (141/1,000) vs both unmarried noncohabitating (36-54/1,000) women, and married women (29/1,000)
Women without a high school degree had the highest rate of unintended pregnancies (73/1,000)
Finer LB and Zolna MR, Declines in unintended pregnancy in the United States, 2008–2011, New England Journal of Medicine, 2016, 374(9):843–852, doi:10.1056/NEJMsa1506575. https://www.guttmacher.org/fact-sheet/unintended-pregnancy-united-states
Labor Statistics
15% of women have their water break before labor begins
I can’t find a study on this, but it seems to be a generally accepted statistic
9.4% (those who had previously had a baby) to 24.6% (first time birthers) have their water broken.
NIH study https://www.ncbi.nlm.nih.gov/pmc/articles/PMC4272504/
World Wide 1 in 5 women have a cesarean section (but they see that continuing to rise to be around 29% in the coming decade)
From a WHO study: https://www.who.int/news/item/16-06-2021-caesarean-section-rates-continue-to-rise-amid-growing-inequalities-in-access
1/3 women (31.8%) in the US ends up with a cesarean section (this rate peaked in 2009 at 32.9%)
Women aged 40 and over are more than twice as likely to deliver by cesarean section (47.3%) than women under 20 (19.4%)
CDC birth Statistics for 2020 https://www.cdc.gov/nchs/data/nvsr/nvsr70/nvsr70-17.pdf
In 2019 births by forceps (.5%) or vacuum (2.5) was only 3% (these are called “assisted deliveries”.)
This # of assisted deliveries is way down from early 1990’s when this was over 9%.
Found on statistica.com https://www.statista.com/statistics/276067/us-births-delivered-by-forceps-or-vacuum-extraction/
Statistics on Tearing at Birth
The majority of women (9 out of 10) will tear to some extend during childbirth (but not all require stitches and will heal on their own)
The chance of a 3rd or 4th degree tear is 1%
If you had a large baby (over 8 lbs 13 oz) the chance of a 3rd or 4th degree tear increases to 2%
If your labor was induced the chance of a 3rd or 4th degree tear increases to 2%
If you had an epidural the chance of a 3rd or 4th degree tear increases to 2%
If the baby is born OP the chance of a 3rd or 4th degree tear increases to 3%
If this is your first baby your chance of a 3rd or 4th degree tear increases to 4%
If you have anassisted birth the chance of a 3rd or 4th degree tear increases to 7%
Information found in a pamphlet from the Oxford Univeristy Hospitals: https://www.ouh.nhs.uk/patient-guide/leaflets/files/12101Ptear.pdf
In 2017 it was reported that the average rate of episiotomies (where the doctor cuts you rather than you tearing) is 7.8% (down from 9.6% the year prior).
Data from the leapfrog group: https://www.leapfroggroup.org/news-events/new-report-maternity-care-us-shows-encouraging-progress-reducing-episiotomies-none
Birth By Race
As reported from 2018-2020
23.7% were hispanic
52.1% were white
15.2% were black
.8% were American Indian/Alasksa Native
and 6.8% were Asian/Pacific Islander
Birth By Age
As reported from 2018-2020 rates are reported per 1,000 women
16.7 ages 15-19
80.1 ages 20-29
75.3 ages 30-39
12.8 were greater than 40
All data about age and race is from the March of Dimes: https://www.marchofdimes.org/peristats/data?reg=99&top=2&stop=2&lev=1&slev=1&obj=1
Random Birth Facts
29% of pregnant women wish they knew more about the stages of pregnancy (statistica)
55.9% of women in the US who were overweight or obese during their pregnancy
1% of births in the US are home births in 2019
2% of births are from infertility treatments in 2019.
6.9% of pregnant women had gestational diabetes in 2019
Stats from (statistica)
Sentinel Event Birth Statistics
Approximately 700 women die in in the US each year as a result of pregnancy or its complications (these are deaths that occur within one year of pregnancy).
Black or AIAN (native Americans) are three times more likely to die in this period (40.8 for black women vs 12.7 for white women per 100,000 live births). Hispanic women had 11.5 deaths/100,000 pregnant individuals (so, lower than whites).
Information from KFF report Nov 2020: https://www.kff.org/report-section/racial-disparities-in-maternal-and-infant-health-an-overview-issue-brief/
33% of pregnancy-related deaths occur during pregnancy
17% of deaths occur on the day of delivery
52% happen after delivery/postpartum
19% of all maternal deaths happen between one and six days postpartum
21% of all maternal deaths are between one and six weeks postpartum
12% take place in the remaining year after birth.
Information from the Commonwealth Fund: https://www.commonwealthfund.org/publications/issue-briefs/2020/nov/maternal-mortality-maternity-care-us-compared-10-countries
Pregnancy Healthcare Provider Statistics
The US has 15 providers per 1,000 live births in the US (meaning OBGYNS, trained physicians or midwives)
For reference, Sweden has 78/1,000; Australia has 75/1,000 and as more of an average, New Zeland, UK and Switzerland all have around 55/1,000. Only Canada has less at 12 providers/ 1,000 people.
Information from the Commonwealth Fund: https://www.commonwealthfund.org/publications/issue-briefs/2020/nov/maternal-mortality-maternity-care-us-compared-10-countries
Labor Nurses make between $68,400-85,100/year (from Salary.com)
OBGYN’s make between $220,000-$410,000/year (from Salary.com)
9.8% of deliveries in 2019 were done by a CNM (certified nurse midwife — the kind I recommend) (from Statistica)
Birth Education Statistics
Approximately 32% of women take a prenatal class
12% of women have a written birth plan
A study in AJOG in 2015: https://www.ajog.org/article/S0002-9378(15)01623-3/fulltext#relatedArticles
Those who took a prenatal class had a lower rate of vaccum extraction (8.2% vs 16.8%)
Those who took a prenatal class had a higher rate of a normal vaginal delivery (75.4% vs 64.1% for those who didn’t take a class)
Those who took a class had a lower c-section rate due to a failed induction (3.3% vs 24.5% in those who didn’t take a class).
American Journal of Obstetrics & Gynecology 2017 https://www.ajog.org/article/S0002-9378(17)32057-4/fulltext
Have you checked a birth class off your to do list✅? I have a few I recommend:
❤️ Best class for couples {per BabyList}
👩💻 Best class available on demand
⚡ Best class JUST for pain management
👶 Best Postpartum-Only Prep
❤️🧡💛💚💙💜 My favorite class is here.
Now is the time to get started!
Postpartum Statistics
70-80% of women will experience “baby blues”
10-20% of women will experience a clinical postpartum depression
These are just general agreed-upon numbers — found in this article. https://www.postpartumdepression.org/resources/statistics/
1/8 (11%) women reported experiencing postpartum depressive symptoms since their birth in a study that surveyed women on average at 4 months postpartum.
This percent was higher at about 20% for those who were under 19, were American Indiain/Alaskan Native, smoked cigarettes during pregnancy/postpartum, or experienced intimate partner violence, or self-reported depression before or during pregnancy.
From a CDC study in 2019: https://www.cdc.gov/mmwr/volumes/69/wr/mm6919a2.htm?s_cid=mm6919a2_w
You can learn the postpartum warning signs here:
Baby Statistics
The average birthweight for babies is around 7.5 lbs
- Boys are usually heavier than girls
- First babies are usually lighter than other siblings
- Larger parents tend to have large babies, and small parents tend to have small babies.
On average, newborns lose about 8 oz in the first 4-5 days after birth, but regain it by 10-12 days of age.
In the first month a typical newborn gains about .7 oz a day or about 4-8 oz in a week.
Average length of babies is 20 inches, and in the first month babies typically grow 1.5-2 inches.
From University of Michigan Health https://www.uofmhealth.org/health-library/te6295

Breastfeeding Statistics
84% of babies are breastfeed at some point
58% are breastfeeding at 6 months
35% are breastfeeding at 12 months
47% exclusively breastfeeding through 3 months
26% exclusively breastfeeding through 6 months
19% of breastfed infants receive formula before 2 days of age
Hawaii had the highest percentage (55%) of babies still breastfeeding at 12 months (although a fairly average # of exclusive breastfeeders at 6 mo 31%).
Mississippi had the lowest percentage (20%) of babies still bresatfeeding at 12 months
From a CDC study in 2020: From a CVD study in 2020: https://www.cdc.gov/breastfeeding/data/reportcard.htm
Cost to Have a Baby
The average out-of-pocket cost to have a baby was $4,569 in 2015
For a c-section, it was $5,161 in 2015
For a vaginal birth it was $4,314
Study by the Univeristy of Michigan: https://ihpi.umich.edu/news/having-baby-may-cost-some-families-4500-out-pocket-study-finds
The national average charge for a vaginal delivery is $12,290
The national average for a cesarean delivery is $16,907
From FAIR Health https://www.fairhealth.org/article/royal-birth-spotlights-us-childbirth-costs
The Average cost of prenatal care through a typical pregnancy is about $2,000 according to Kaiser Family Foundation.
If you liked this post and want to get more informed about your delivery, come join me in The Online Prenatal Class for Couples. It can be done in just a few hours and with 3 price points I’m ready to meet your budget needs.
Want to do a vibe check before diving into the whole thing with me? — check out my free labor pro tips. It’s your first step toward getting in the driver’s seat of your birth.
Which statistic did you find most interesting? Did anything completely surprise you? Tell me about it in the comments.
FYI, this post was originally written in March 2022, and has been updated.


 What To Do If Your Labor Goes Long?
